
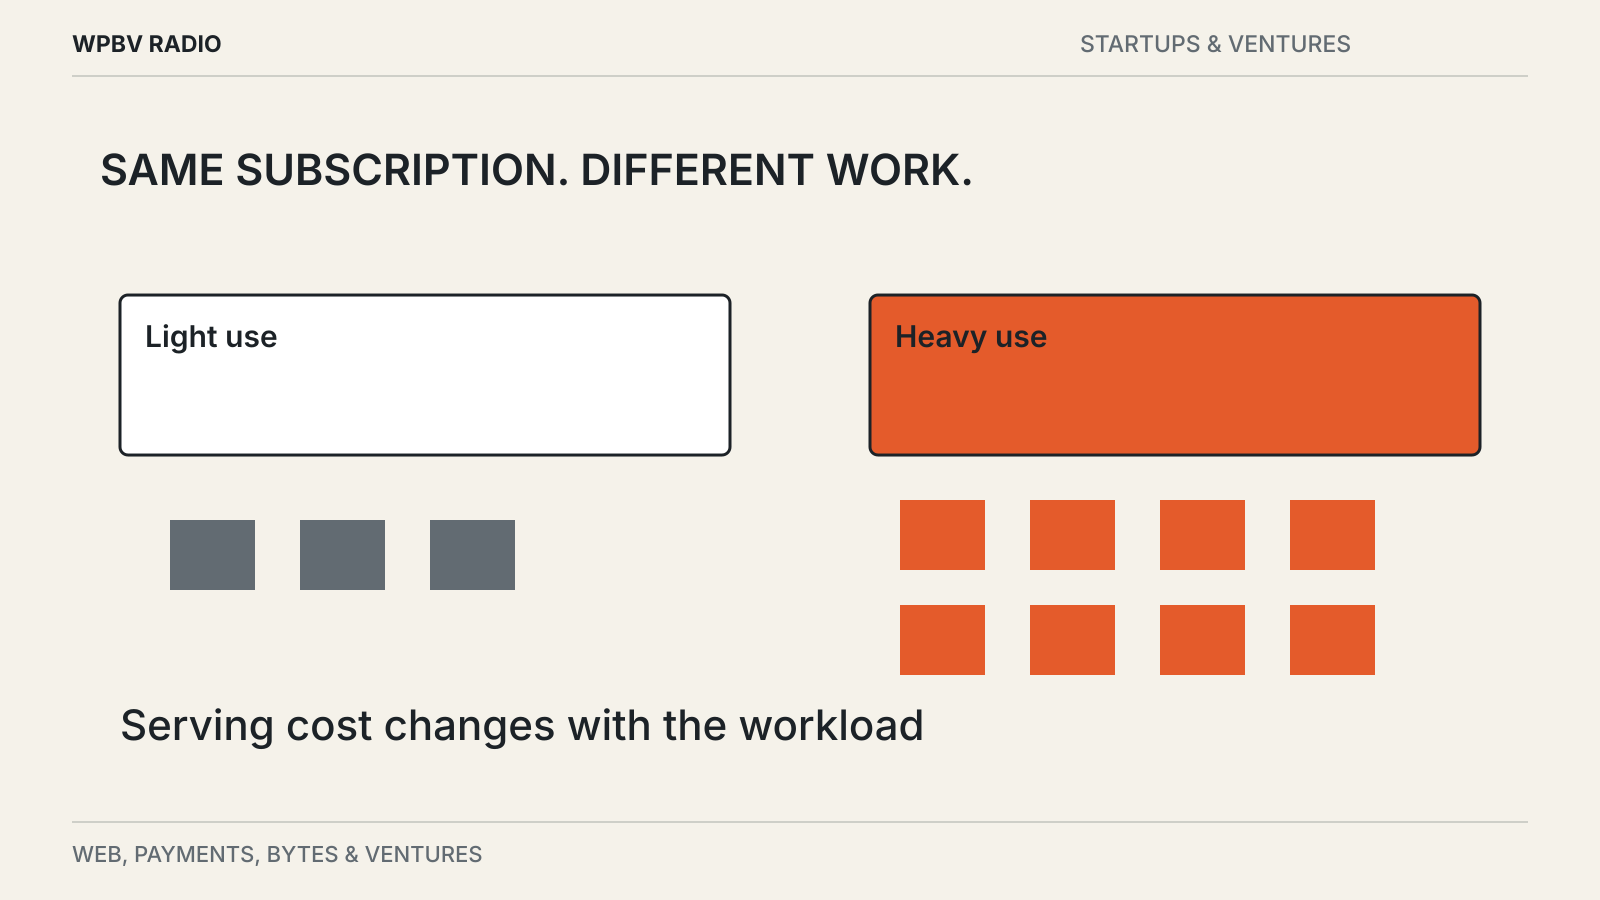
Two customers each pay an AI app $30 a month. One asks a few questions a week. The other runs long document jobs every day. The revenue per customer is identical; the cost of serving them may be very different.
Average revenue per user is a useful measure of what a business collects. It is not a measure of what remains after delivering the service.
Follow the cost of the work
An AI product may pay for model inference, storage, document processing, search, tool calls and support. Some costs rise with usage, while others are shared across the business.
A request count alone can hide large differences. A short rewrite and a multi-step research job may each appear as one task to the user, while consuming very different resources behind the interface.
Stripe’s gross-margin guide explains the distinction between revenue and direct service costs. Accounting classifications vary, so a comparison should state which costs are included rather than relying on a percentage without a definition.
An average can hide the expensive tail
Consider an invented example. A service has 100 customers paying $30 each, producing $3,000 in monthly revenue. Ninety customers cost $5 each to serve; ten heavy users cost $100 each.
The service costs in this simplified example total $1,450. That leaves $1,550 before other expenses. If all customers had cost $5, the remainder would have been $2,500. The same revenue per user describes two very different outcomes.
These are illustrative numbers, not measurements of any company. They show why it helps to inspect the distribution of usage and cost, particularly when a small group can run many long tasks.
Retention changes the calculation
A customer who pays for one month and leaves is different from one who renews for years. Acquiring both may have required the same marketing spend.
Stripe’s SaaS business guide connects recurring revenue with customer acquisition and retention. For an AI product, that relationship should be considered alongside potentially material costs for each additional task.
A price increase may improve revenue per customer while causing more people to cancel. A generous free tier may bring many sign-ups but few paying customers. Looking at one metric can make either decision appear better than it is.
Compare groups of customers who joined at similar times. See whether they keep using the product, continue paying and become more or less expensive to serve.
Product design affects the cost structure
The company can route simple tasks to less expensive models, reuse appropriate cached results or ask users to confirm costly operations. It can also improve document retrieval so the system sends less irrelevant material into the model.
Those choices need quality checks. Reducing cost by producing more errors may simply move the expense into retries, support or lost customers.
Pricing can reflect usage through credits, limits or separate tiers. The user then needs a clear explanation of what a task consumes. A subscription that appears unlimited but repeatedly stops at an obscure threshold creates a different kind of product problem.
Ask for definitions before comparisons
When a company reports margins or customer value, check the period, customer group and included costs. Are free users counted? Are annual contracts treated consistently? Does the reported margin exclude expenses that another company includes?
You do not need a perfect financial model to recognize an incomplete claim. “Revenue rose” is meaningful, but it does not answer whether serving that revenue became more expensive.
Our funding announcement guide explains the same discipline for investment headlines: keep the disclosed fact separate from conclusions the disclosure cannot support.