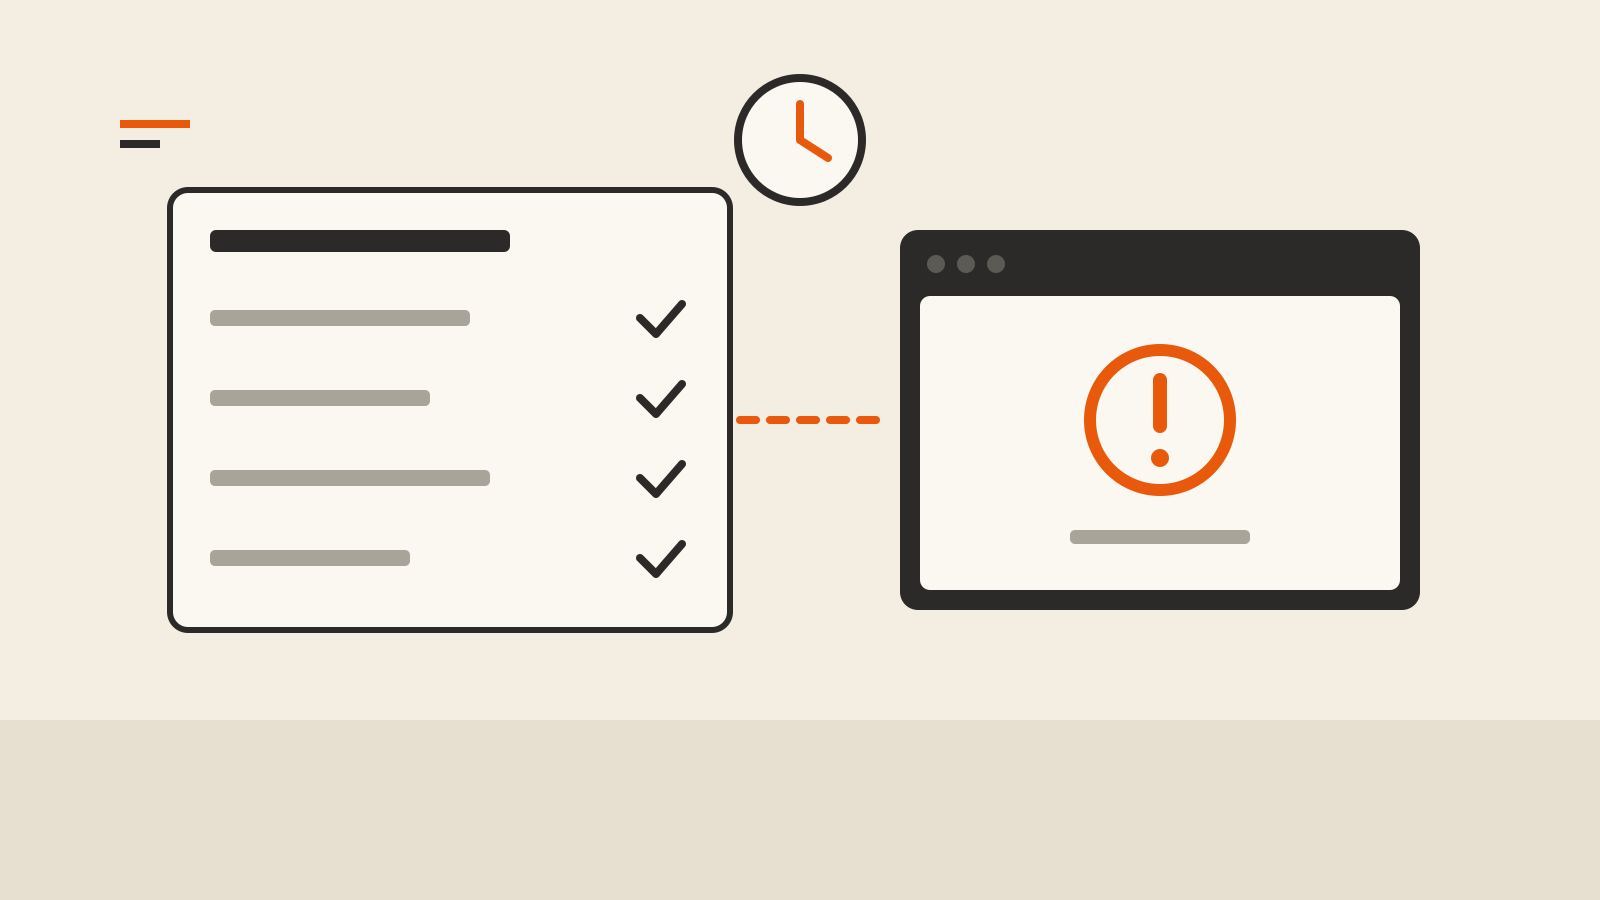
Your checkout starts throwing errors at 15:50 UTC. You open your cloud provider’s status page and every row is green. Ten minutes later it is still green, and you begin to wonder whether the problem is your code. A status page during an outage often trails the outage itself, and that is not usually a cover-up. It is the result of how incidents are detected, confirmed, scoped and written up. Knowing where those minutes go tells you how much weight to give the green rows and where else to look.
A real example: 26 minutes before the first word
On October 4, 2026, one Availability Zone in AWS’s Spain region started losing packets at 8:48 AM Pacific time. The event summary on the AWS Health Dashboard says AWS was “automatically alerted to the issue at 8:54 AM.” The first public post, “We are investigating elevated packet loss in the EU-SOUTH-2 Region,” appeared at 9:14 AM. The update that narrowed it to a single zone came at 9:36. Our news report on the AWS eu-south-2 outage has the full timeline.
So for six minutes the provider did not know yet, and for another 20 it knew but had not said. For anyone running in that zone, those 26 minutes were spent looking at a page that did not match what their users saw.
Other recent incidents show the same shape. In Microsoft’s preliminary review of the September 30 Azure gateway incident, customer impact began at 20:30 UTC, the investigation of ExpressRoute problems in UK South started at 21:29, and Microsoft found that several regions were affected at 22:27. Railway’s report on its September 30 routing disruption puts the 404 errors between about 07:35 and 07:40 UTC; its status page entry went up afterwards and called itself “a post facto report.” A short incident can be over before the status page mentions it.
Where the minutes go
Detection. Monitoring has to notice that something is wrong, and it is tuned not to wake engineers for every blip. Cloudflare’s account of its November 18, 2025 outage gives a sense of the speed when it works well: impact began at 11:28 UTC, the first automated test caught it at 11:31, and an incident call opened at 11:35.
Confirmation and diagnosis. An alert says a number crossed a line. Before posting, engineers usually want to know which product, which region and whether customers are really affected. Early symptoms mislead. Cloudflare says that in November 2025 its system kept recovering and failing again, and “initially, this led us to believe this might be caused by an attack.”
A person writes the post. On most status pages a human creates the incident. Atlassian’s Statuspage, a widely used hosted product, lets a team create an incident with one of four statuses: Investigating, Identified, Monitoring and Resolved. Its documentation says components can be updated manually or automatically through an integration, the API or email, but “the most common method” is to change them while creating an incident. If no one has opened an incident, the rows stay green.
Scope rules. The big providers do not post every problem on their public page. Google Cloud’s incident communication policy uses the public Cloud Service Health dashboard for “broad severe incidents.” Issues “impacting a single location, zone, or a smaller subset of projects” go only to Personalized Service Health, which affected customers see inside their own console. Microsoft’s Azure Service Health overview calls the Azure status page “a good reference for incidents with widespread effect” and strongly recommends the personalized Service Health view to current users. AWS’s dashboard documentation says the public page “only shows public events, which are not specific to an AWS account.” A real problem for your account can therefore never appear publicly at all.
When the status page breaks too
The tooling that publishes updates can share the fault it is meant to report. In AWS’s summary of the December 7, 2021 US-EAST-1 event, network congestion impaired internal monitoring and stopped the Service Health Dashboard tooling “from appropriately failing over to our standby region.” Impact began at 7:30 AM Pacific time, and AWS was successfully updating the dashboard by 8:22. The same report says the ability to create support cases was impaired from 7:33 AM until 2:25 PM, and that the single global banner AWS used “makes it difficult for some customers to find information.”
Providers try to avoid this by hosting the status page elsewhere. Cloudflare says its status page “is hosted completely off Cloudflare’s infrastructure with no dependencies on Cloudflare.” During the November 2025 outage it went down anyway, by coincidence, and that led some of the team to suspect an attacker was targeting both. Google also notes that Personalized Service Health depends on core services such as Identity and Access Management, so in a wide outage you may not be able to sign in to see it; its fallback advice is the public page at status.cloud.google.com.
What the colors and labels mean
Once an incident is posted, the wording is more precise than it looks. On Statuspage, a component has one of five statuses. “Degraded performance” means it works but is slow. “Partial outage” means it is “completely broken for a subset of customers,” such as those whose data lives in one data center. “Major outage” means it is completely unavailable.
The page’s headline line is calculated from those rows. Atlassian’s notes on top-level status show that a single component in major outage, with the others fine, produces a headline of “Partial System Outage.” The incident labels matter too. “Monitoring” means the team believes the fix is in and is waiting for symptoms to subside. It is not the same as “Resolved.”
One more detail affects what reaches your inbox: on Statuspage, component status changes on their own do not send notifications. “Only incidents trigger subscriber notifications.”
What to check instead
- Your provider’s personalized view. AWS has the signed-in account health page and health events in Amazon EventBridge, Azure has Service Health and Resource Health, and Google Cloud has Personalized Service Health with log-based alerts. Set up the alerts before you need them.
- Your own monitoring. Error rates and latency from your own service are the earliest signal you have. If they jump and the provider page is green, assume the problem is real and keep collecting timestamps.
- The zone and region. A single-zone problem may show up for some of your instances and not others. On AWS, compare zone IDs rather than zone names: the ID points to the same physical zone in every account.
- Machine-readable feeds, with care. AWS warns that its RSS format “is subject to changes” and recommends EventBridge for automated use.
- The record afterwards. A green page during the incident does not mean nothing happened. Check the provider’s history page and post-incident report, and compare its times with yours. Our cloud outage tracker collects dated provider reports.
Treat the status page as the provider’s official statement, not a live sensor. It tells you what the provider has confirmed and chosen to publish. Your own graphs tell you what is happening now.